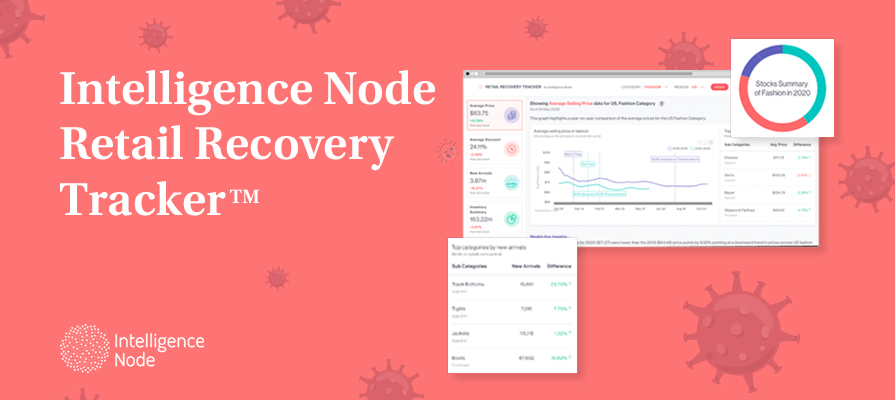
Weekly insights into market trends, inventory movements, and pricing across the US Fashion Industry.
Learn how Intelligence Node’s data can help retailers make informed decisions and accelerate their retail recovery.
The retail world is fast evolving with dramatic shifts happening daily – especially with the COVID-19 pandemic in the picture. In just the last 8-weeks of quarantine, eCommerce growth in the US climbed to 27% from 16% – the same amount of market share growth it achieved over the past 10 years!
With such a dramatic acceleration in online business, we are in for unprecedented changes across many retail sectors. Businesses will need data on their side to make informed decisions based on consumer shopping behavior, competitor movements, and retail trends. Through this tracker, we aim to give retailers a sneak peek into just a few of the many data-driven insights we can provide eCommerce leaders and decision-makers. This particular dashboard shows a high-level view of year-on-year comparisons across prices, discounts, and new arrivals to analyze market movements and take the next step accordingly.
Here are some key take-aways:
The Intelligence Node Retail Recovery Tracker, aggregated from a diverse cross-section of U.S. fashion eCommerce websites, is easy to navigate and offers baseline comparisons across dozens of fashion sub-category topics. Retailers can see how the fashion market is reacting to major events, how it’s performing in comparison to the previous year, and which sub-categories are performing better than the others with respect to price changes, discounts, and new arrivals.
Average US Fashion product discounts saw a steady rise, from 18.25% in January 2020, just as COVID-19 cases were beginning, to 21.75% in late May. We saw a large rise in discounts in May, with average discounts going as high as 4.5% compared to the same period last year, which could be accounted for retailers resorting to heavy discounting to clear out older stock.
In Q3 2019, there was a dramatic increase in new arrivals as US retailers ordered Chinese goods early in an attempt to avoid the increased rates post tariffs imposed by Trump on Chinese imports.
Then, as the 2020 Lunar New Year celebrations started in China at the end of January, the new arrivals saw a steep climb. The first reason for this trend is that retailers stock up on products before the Lunar New Year celebrations start every year which goes on for around 15 days. The second reason for such a big spike around the same time could also be on account of stores shuttering and enforcement of social distancing due to the pandemic, coaxing many fashion retailers to list their in-store stock online, to push inventory out.
This is just the tip of the iceberg! Stay tuned as we unravel additional categories, deeper analysis, and new features in our retail recovery tracker – with the food and grocery sector coming up next.
Looking for real-time retail insights and competitive intelligence specific to your sector? Book a demo with us or write to us at sales@intelligencenode.com with your queries.


